Tableau Dashboard Actions: Use-Cases, Examples, and Functionality
Tableau dashboard actions can greatly improve your user experience. See how to set them up, some great use cases, and how to resolve common problems!


Overview
Since its release in 2003, Tableau has exploded in popularity thanks to its ease of use, flexibility, and powerful visualization tooling. Acquired in 2019 by Salesforce for $15.7 billion, Tableau remains one of the most popular B.I. and analytics tools of 2022.
Of Tableau's expansive functionality, dashboard actions, parameters, and filters are advanced features that provide granular control over analysis. These tools enable the end-user to access the information they need, which is critical in data visualization to enable discovery and self-service analytics.
In this article, we'll discuss Tableau dashboard actions in-depth, starting with the basics and working our way towards more creative use cases.
Setting Up Tableau Dashboard Actions
Dashboard actions add context and interactivity to Tableau elements. Users may engage with charts, maps, and tables. Additionally, the actions you configure may dynamically respond with navigation and changes in view.
These actions are also easy to configure: we'll discuss how to implement a few different types.
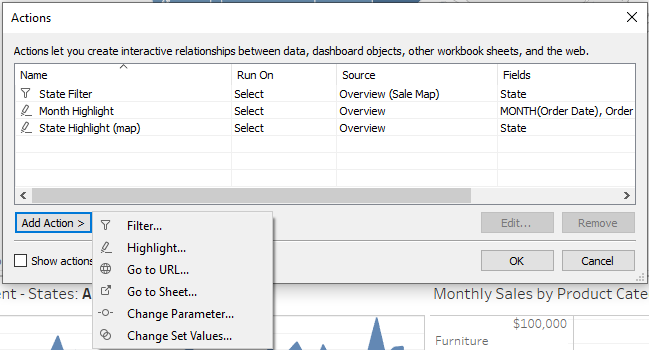
To set up a new dashboard action, navigate to “Dashboard > Actions” at the top of the Tableau navigation bar from any dashboard view. You’ll be prompted to add the action and have six options to choose from:
- Filter— use the data from one view to filter data in another to help guide analysis.
- Highlight— call attention to marks of interest by coloring specific marks and dimming all others.
- Go to URL— create hyperlinks to external resources, such as a web page, file, or another Tableau worksheet.
- Go to Sheet— simplify navigation to other worksheets, dashboards, or stories.
- Change Parameter— let users change parameter values by directly interacting with marks on a viz.
- Change Set Values— let users change the values in a set by directly interacting with marks on a viz.
After choosing the action type, you’ll see a new screen where you can add logic to your dashboard action.
Towards the bottom, you’ll see Source Sheets, which shows each sheet the new dashboard action will be added to— you can select any sheets you want for the action you’re adding. You’ll also see Target Sheets, which shows each sheet where the action will take place.
In the top right corner, you’ll see three options for Run Action On. From the Tableau Docs, here are their descriptions:
- Hover— rest the pointer over a mark in the view to run the action. This option works well for highlight and filter actions within a dashboard.
- Select— click a mark in the view to run the action. This option works well for all types of actions.
- Menu— right-click (control-click on Mac) a selected mark in the view and then select an option on the context menu. This option works well for filter and URL actions.
Under those options, you’ll see Clearing the section will, which lets you choose what happens when the dashboard action gets cleared (accomplished by tapping escape). These options are:
- Leave the filter— this option leaves the last action that occurred in place.
- Show all values— this will revert back to the dashboard’s original view as if the action had never happened.
- Exclude all values— this clears the entire target sheet, meaning that it won’t appear unless you execute another dashboard action.
Related:
Tableau Action Filters: An In-Depth Look
A Tableau Dashboard filter is a simple way to send information across worksheets or dashboards. They provide a way to create interactive dashboard elements and enable interactivity. For additional information on how to build an action filter from scratch, see Tableau's documentation.
Types of Action Filters
Tableau continues to develop their actions functionality. Here are the action types as of 02/22:
- Filter actions— leverage worksheet marks to pass data from one worksheet to another. This method is similar to a quick-filter but can be more targeted and enabled through users interacting with a worksheet.
- Highlight actions— leverage one data point on one sheet to highlight other data points on different sheets. Learn how to build advanced highlighting actions.
- Go to URL actions— leverage a data point on a sheet to open a web page or URL with the ability to customize the URL with marks, values, parameters, or data points. Learn how to build Go to URL actions from scratch.
- Go to Sheet actions— navigate from one dashboard to another by selecting a mark on a sheet (See example below). Get started with a Go to Sheet action.
- Change Parameter actions— Change the value of a parameter by selecting a target field on a sheet. Instead of changing a parameter with a filter style UI, users can simply select target fields to pass to the parameter. Parameter actions can be used with reference lines, calculations, filters, and SQL queries, and to customize how you display data in your visualizations. Create a Change Parameter action from scratch.
- Change Set Value actions— Dynamically add or remove members from a set by selecting marks on a sheet. Create a Change Set Value action from scratch.
Creative Uses for Dashboard Actions
Let’s look at three ways that you can leverage dashboard actions to help improve your user experience:
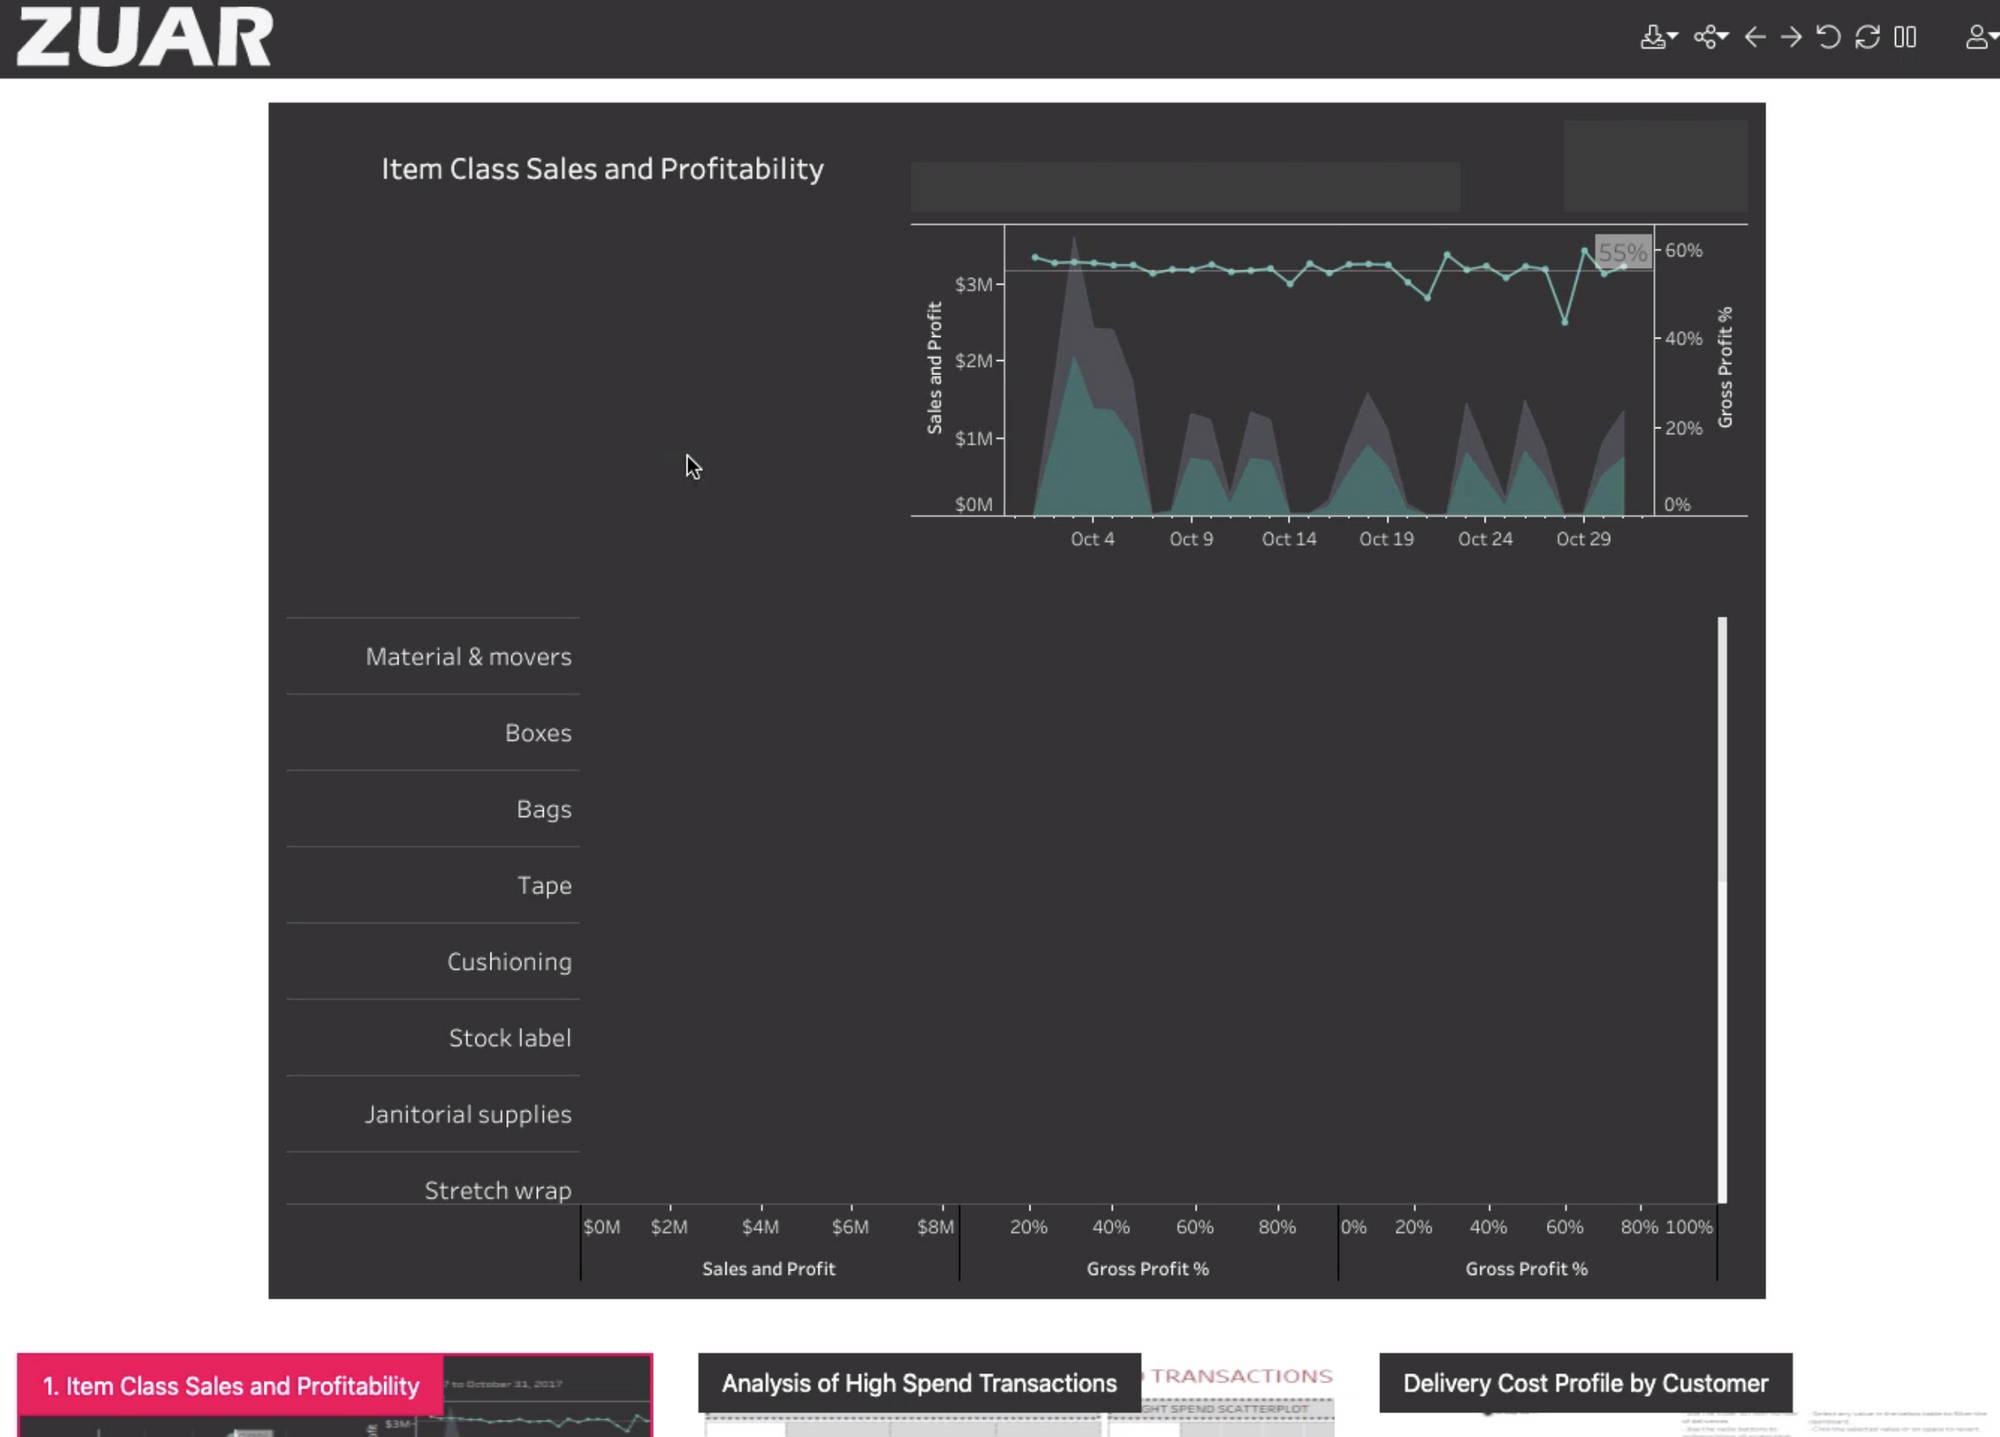
Use Case: Using Every Sheet as a Filter
Adding the ability to use every sheet as a filter is an easy way to add functionality to your dashboard and give your users more flexibility in choosing how they view the data.
Here’s how to set it up: On each sheet that you'd like to use, hover over the sheet and click on the down arrow in the upper right corner. Select Use as Filter to enable the sheet as a filter. Now, when you click on any of those sheets the others will be filtered your original selection.
Use Case: Embedding YouTube Videos in a Dashboard
Having the ability to embed a YouTube video in your dashboard allows the creator to provide relative context and even video walkthroughs. Unfortunately, it can be a tricky to implement properly. To find the right link to use as your data source:
- Navigate to the video you want to embed.
- Click on the Share button below the video.
- Click on the Embed tab.
- Copy the URL that shows up between the quotations.
Once you have the link, here’s how to embed it to your dashboard using dashboard actions:
- Add a Web Page component to your dashboard by dragging and dropping it from the left navigation bar on your dashboard. Note: Tableau will ask for a URL when you add the web page - leave it blank for now.
- Add a URL action as described in the previous sections.
- You should see an empty URL box with an arrow to the right of it. Click on the arrow and add the URL you found earlier.
Use Case: Performing a Google Search From a Dashboard
With this action, users get the ability to explore just about anything within the dashboard for thousands of various data points. Here’s how to set up your dashboard for Google (or Google Image) searches:
This example is how Ryan Sleeper created his “We’re Not in Kansas Anymore” interactive dashboard, which allows users to click on any location on the map to open a Google Image search of that location.
- On Google Images, search for any of the locations you want to add.
- Copy the URL from the browser. For example, searching for Kansas City gets you this URL:
https://www.google.com/search?q=kansas+city&source=lnms&tbm=isch&sa=X&ved=0ahUKEwiH6eqWhoDKAhVWz2MKHctYBJsQ_AUICSgD&biw=1366&bih=643 - You can use the entire URL, but any info after the “=isch” (bolded above) is not needed.
- Add a URL dashboard option like described in the above sections. In this example, Ryan uses the “Select” option when prompted to choose the “Run action on.”
- Finally, paste your Google search URL into the empty URL box, and replace the query section (bolded above) with whichever field you want to use from your data.
Related:

Use Case: Adding a Filter to Tableau Dashboard— Embedded Analytics
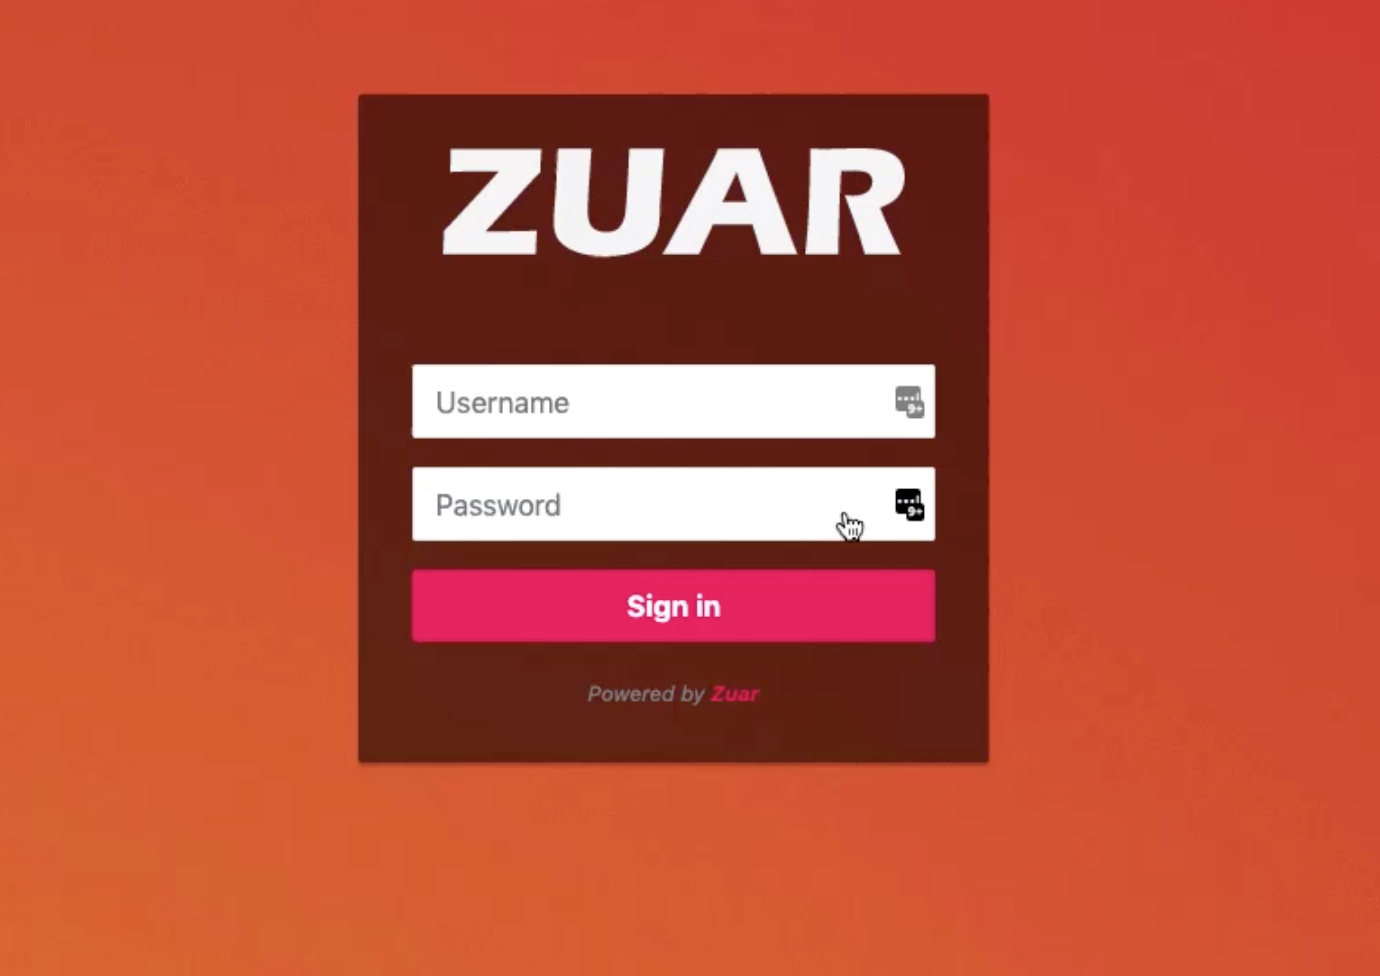
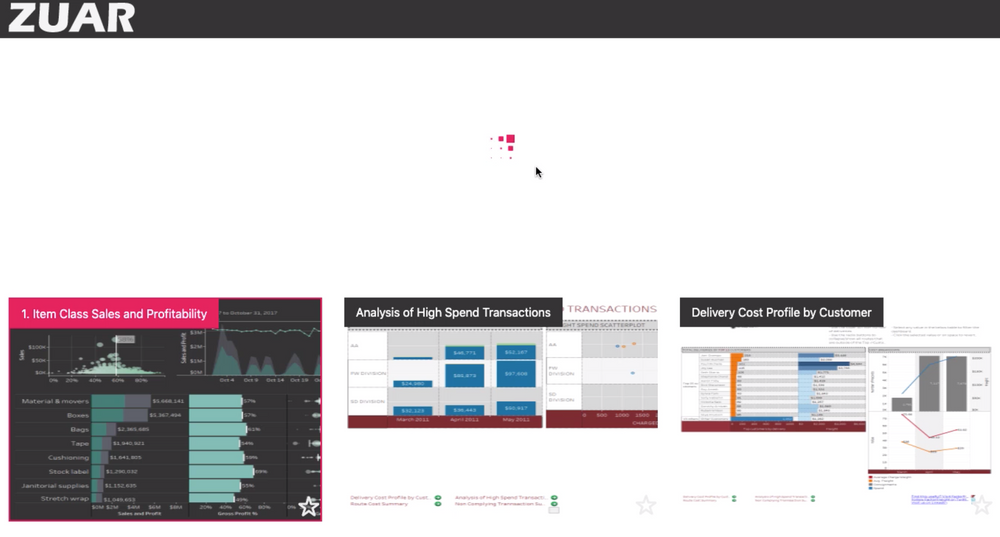
Portals are a method of sharing content that is growing in popularity within the Tableau ecosystem. Here’s a glance at a demo Zuar Portal:
Why is this so important?
- The user may customize the look and feel of their dashboard to be their own, not Tableau’s (you can even hide the fact that you’re using Tableau from your users)
- Tableau’s capabilities may be extended, using the Javascript API
- Dashboards may have additional context when placed alongside original content (as much as I love data visualization, there is always value in having additional context).
- Security: the portal acts as a web application firewall (WAF) in front of your Tableau Server.
- Single sign-on (SSO): your users don’t have to log in to Tableau Server/Online once they are securely authenticated in your portal.
To see how easy it can be, here’s a blog post showing not one, not two, but three quick ways to embed a Tableau dashboard into a webpage.
Conclusion
In our walkthrough, we provided a window into Tableau Dashboard Actions and their capabilities. We discussed how to use filters in the dashboard and presented some use-cases and common functionality to enable your team to provide self-service, context-aware analytics.
As Tableau's popularity continues to grow, it's important to understand how to leverage its functionality for a seamless analytics experience. Using Dashboard Actions, analytics can be more user-centric and engaging than ever.
Worried that a portal is too challenging or time-consuming to set up? Zuar can spin one up for you within a day, on a free trial basis!
Looking for help with your next Tableau project? We have the expertise to implement whatever you need, no matter how complex. Learn more.